Investigate the market. Enjoy the show.

Same price.
Different positions.

An investigator follows the Bitcoin. The believers want a discount.
The whales want an exit. The crowd would prefer not to be dinner.

Everyone’s watching the price.
Who’s watching the biggest buckets?

An investigator follows the Bitcoin—and watches the giants, the believers and the crowd.

The TrackBTC storyEnjoy the Show 2:50
Read the film transcript

Bitcoin’s dead. Again.

Everyone’s desperately emptying their buckets. Our guy’s attending his third Bitcoin funeral this month.

But he looks downstream.

Why are the biggest buckets getting fuller?

Everyone’s watching the price. He follows the Bitcoin. Who’s receiving—and how much are they keeping?

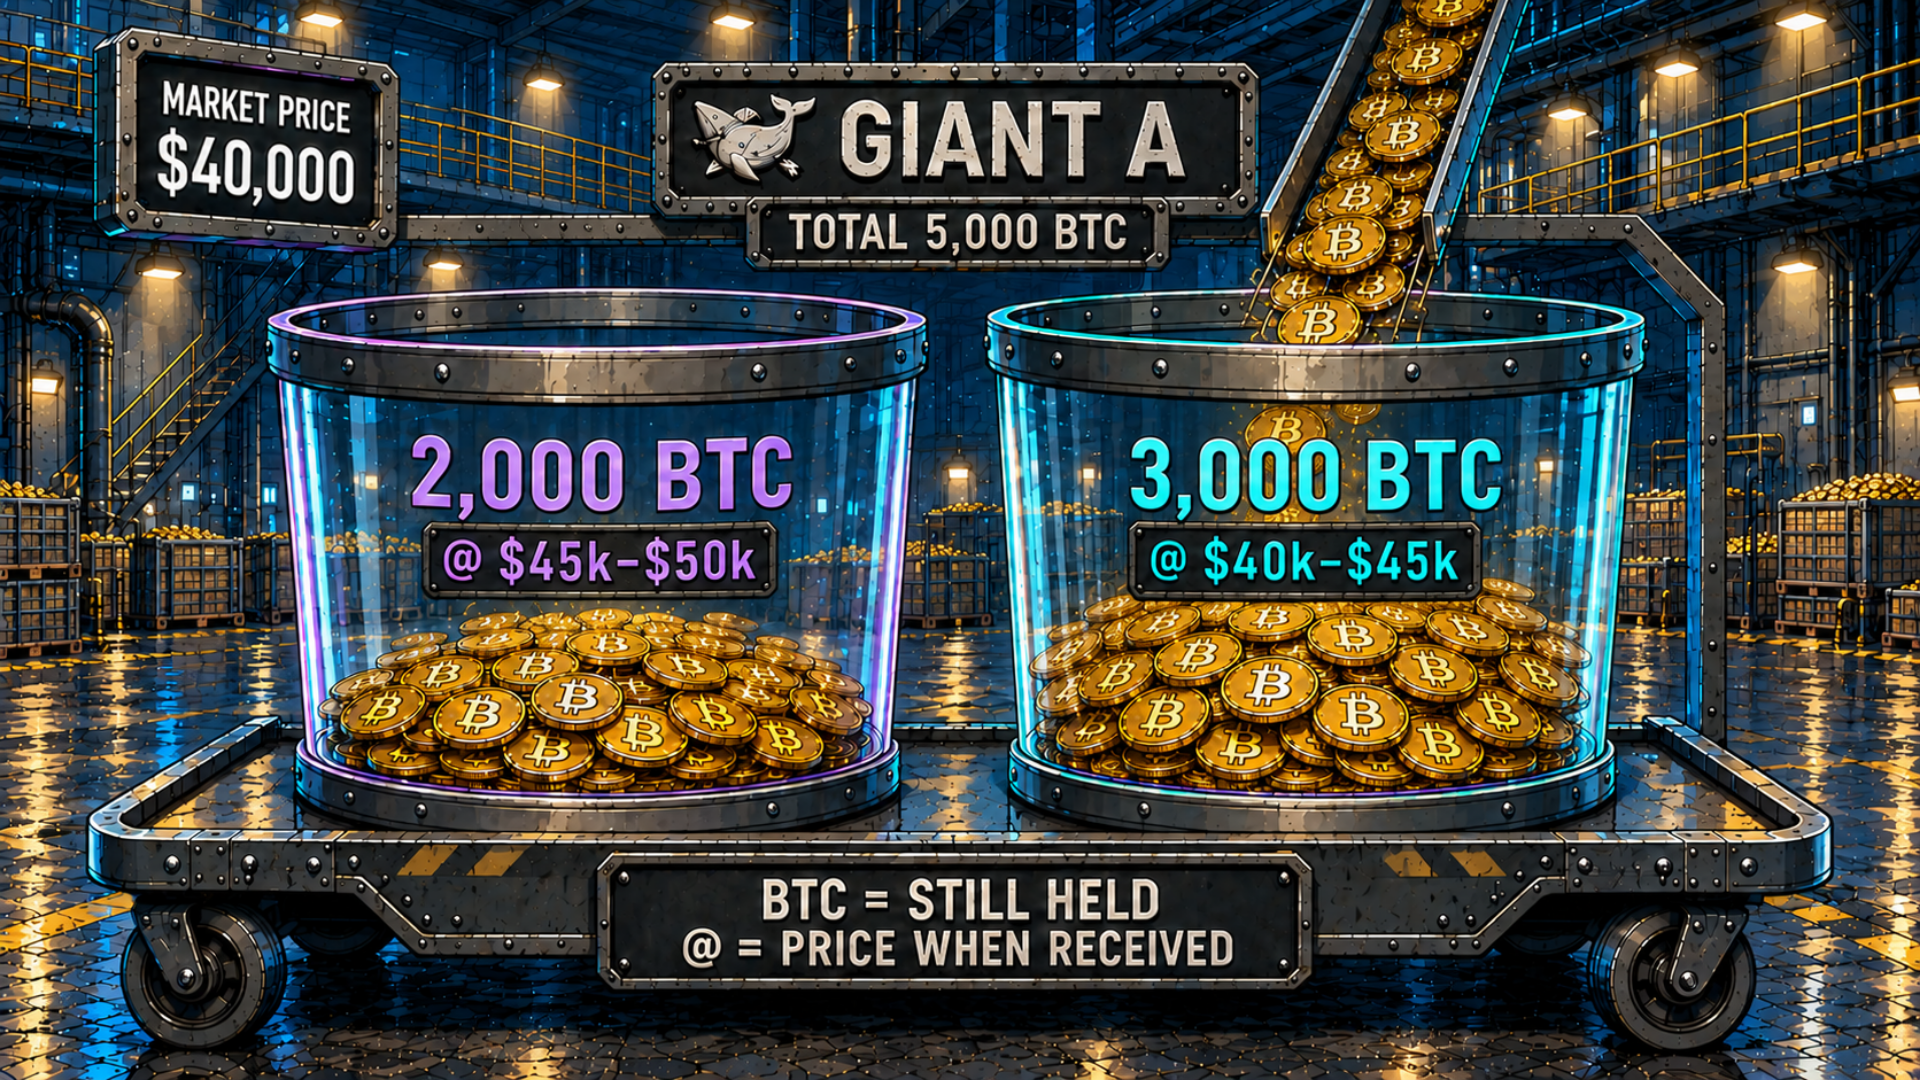
The tag is the price when it arrived. The number is how much they still hold.

The price falls. More Bitcoin arrives. Different price bucket. Same giant.

Upstairs, financial Armageddon. Downstairs, they’re going to need a bigger trolley.

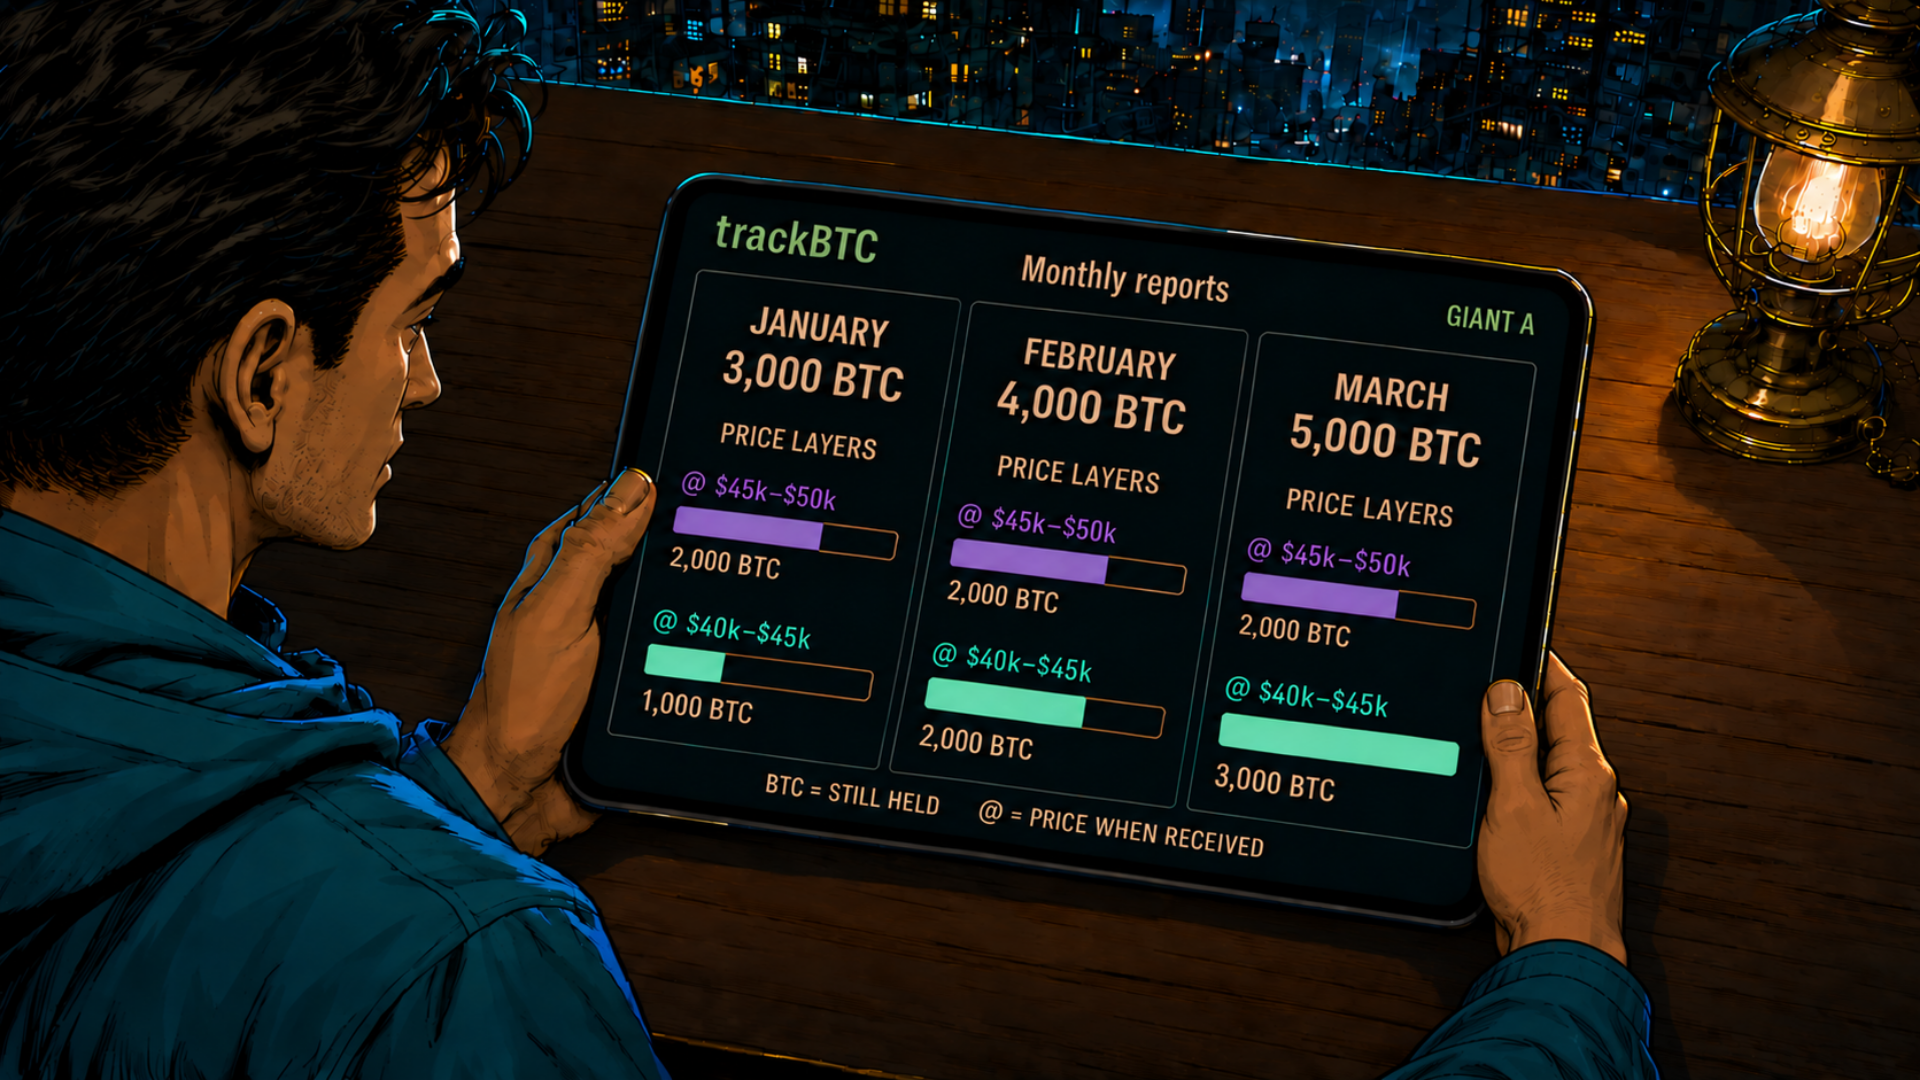
He checks the monthly reports. Same giant. That lower-price bucket keeps getting fuller. He checks the dates. This started before today’s screaming. The flood didn’t destroy the Bitcoin. It changed who was holding it.

Now. Who’s hoping for what?

Bitcoin’s at fifty-four grand. Eight hundred Bitcoin hit exchanges in four hours.

Same market. Three agendas.

The believers always hold. But their cash? That still has standards.

Five-forty buys point-zero-one Bitcoin today. At forty-five grand, it buys twenty percent more. Buy a little now. Keep some cash ready—in case the next funeral comes with a bigger discount.

Millions of addresses. Ridiculous math. The whales’ overall price layers, laid out.

Now they do their napkin math. Average entry: forty-four grand and change. Their twenty percent is already there. Take profit, crash them out, reload cheaper. Such a touching interest in everyone else’s future.

And these guys? Before following the crowd, they check the giants.

Their overall price layers. The pressure at exchanges. The giant’s up nearly twenty-two percent. They’re up sixteen. Same price. Different positions. Follow his exit—or become it?

They’d prefer a seat at the table. Not a place on the menu.

Same reports. Very different intentions.

Get comfortable. Enjoy the show.

Meet the cast

One investigator.
Three very different agendas.

Same market. Same reports. Wildly different reasons to open them.

The investigator in his teal coat watches the crowd mourn Bitcoin in a flooded street.
The investigator

Everyone’s losing it.
He’s following the Bitcoin.

Another funeral. Another crowd convinced it’s the end. He opens TrackBTC to see who’s holding, who’s moving, and where the biggest buckets sit.

Monthly history gives him the backstory. Four-hour reports show the next turn. He watches the characters make their moves.

Follow the evidence
The believers hold their Bitcoin buckets close with unwavering devotion.
The believers

Faith in Bitcoin.
Standards for the discount.

The believers always hold. Their cash is a little more selective. They use TrackBTC’s price layers and pressure readings to weigh today’s discount against the possibility of a bigger one.

Buy a little now. Keep some cash ready—in case the next funeral comes with a bigger discount.

Inspect the price layers
The whales collect Bitcoin in enormous transparent buckets while the crowd panics.
The whales

Twenty percent.
Then crash them out.

Millions of addresses. Ridiculous math. TrackBTC lays out their overall price layers; they bring the napkin math. In the film’s example, their twenty percent is already there.

Take profit, crash them out, reload cheaper. Such a touching interest in everyone else’s future.

Follow the giants through history
The crowd in mustard, purple and rust coats checks its position while holding small matching Bitcoin buckets.
The crowd

A seat at the table.
Not a place on the menu.

Before following the crowd, they check the giants. TrackBTC’s overall price layers and pressure at exchanges help them compare positions and work out their own price strategy.

The giant’s exit might be their disaster. They’d like to understand the move before becoming a whale’s meal.

See what changed in four hours
01 / Understand the position

When did it arrive?
How much is still there?

Bitcoin reaches the same wallet group at different market prices. Price Layers show those ranges and how much Bitcoin remains held in each.

Two buckets. Two price ranges. One giant. The market price can change while the tags stay fixed.

A wallet group connects addresses through observed on-chain links. It does not establish the identity of a person or company.

Follow the position over time
Illustrative Giant A holds 2,000 BTC received at $45k–$50k and 3,000 BTC received at $40k–$45k, in two buckets on the same trolley.
@ · Price when received
The market price when Bitcoin arrived.
BTC · Still held
How much remains in that price range.

Illustrative example from the film. Receipt prices are not proven purchase costs or profit.

02 / Monthly reports

One movement catches your attention.
History gives it context.

Did large holders accumulate or distribute? Was it a one-month move or part of a longer pattern? Explore a complete month of balances, behavior and price context, then follow the same groups through the surrounding months.

Large-Holder Regime

Read the month’s overall posture.

See the balance between accumulation and distribution, the Bitcoin added and reduced, and how many groups participated. Follow the monthly pressure reading alongside its absorption and distribution components.

Pressure & price

Compare the market with the holders.

Read daily BTC/USD beside daily and running balance changes. Compare completed months to see where price and large-holder pressure agreed, diverged or changed direction.

Historical comparisons

See how the posture developed.

Compare the report month’s large-holder regime with one, three, six and twelve months earlier. Follow the selected wallet groups through the available historical observations to see whether the month’s behavior was unusual or persistent.

Movement

Separate activity from balance change.

Explore how much Bitcoin the tracked giants sent and received, how their combined balance changed, and how movement was distributed across sizes. Daily charts put those movements beside price.

Wallet-group evidence

Open the groups behind the totals.

Inspect ranked groups, their previous-month change and historical comparisons. See which tracked groups ended higher, lower or empty, and how concentrated each behavior was among the leading groups.

Price intelligence

Follow value across market levels.

Explore receiving and sending prices, retained balances and the balance path through observed history. HODLer evidence follows conviction across price levels; Deep Storage evidence follows formation, dormancy and reactivation.

Four behavior chapters

Different activity. Different evidence.

Whale Moves, HODLers, Deep Storage and Consolidations each have their own qualifying groups, rankings and historical comparisons.

Whale Moves

Where the large movements happened.

Explore qualifying large-movement groups, how much moved, and how their activity compares with the surrounding months.

HODLers

Who kept the Bitcoin.

Inspect the groups behind retained holdings, their balance changes and how their behavior developed through the comparison months.

Deep Storage

What stayed quiet—and what moved.

Follow storage behavior, the history behind stored balances, and observed reactivation in the wallet-group evidence.

Consolidations

Where Bitcoin was gathered together.

Inspect qualifying consolidation activity, the groups behind it and its concentration over time.

The film’s monthly reports show Giant A’s $40k–$45k layer growing from 1,000 BTC in January, to 2,000 in February, to 3,000 in March. Its $45k–$50k layer stays at 2,000 BTC.

Same giant · Same $40k–$45k receipt-price layer

January
1,000 BTC still held
February
2,000 BTC still held
March
3,000 BTC still held

Illustrative history from the film.

Explore 12 completed months of large-holder behavior, movement, and price context.

Discuss historical replay
03 / Month in Motion · four-hour reports

Still filling—
or starting to move?

What arrived? What remains? Where did it move? Each report examines one fixed four-hour window, with hourly evidence inside it and a comparison with the preceding four hours when that evidence is available.

Highlights

Start with what mattered.

Read the lead story and supporting activity, then open the underlying transactions. A completed window can also have a quiet result when no movement meets the signal criteria.

Power Brokers

Meet the groups behind the turn.

Start with featured wallet groups, then expand the ranked list. Inspect movement, balance change, Flow pressure, linked events and receiving/sending price layers for each group.

Important Events

See why a movement stood out.

Explore ranked transfers, balance changes, faster activity, pressure reversals and price-layer movements. Filter events and open their amounts, timing, reference prices and other ranked patterns.

Window comparison

Is activity accelerating or changing direction?

Compare the selected and preceding windows. Movement measures external Bitcoin sent and received. Velocity puts that movement against opening balances. Flow pressure shows the balance between incoming and outgoing value.

Price Motion

Put the events on the clock.

Explore BTC/USD, balance change, Velocity and Flow pressure hour by hour. Event markers connect the chart to individual movements. A second view places the selected window inside the wider UTC day.

Receiving, sending & Retention

Inspect the price layers behind the movement.

See incoming and outgoing Bitcoin by reference-price band, weighted receiving and sending prices, and their spread. Expand a Power Broker to compare its layers and opening/closing balances with the previous window.

Inspect the calculations. Expand the figures behind the comparison: selected values, previous values and changes. Reference prices describe the market around observed movements; they do not establish purchase costs, execution prices or profit.

The unfolding day

Keep following the changes.

A UTC day contains six four-hour windows: 00–04, 04–08, 08–12, 12–16, 16–20 and 20–24. The viewer displays times in your local timezone. Developing windows show their evidence coverage; future hours remain empty. Read completed windows in sequence to follow the day.

010203040506
Six turns. One day in motion.
Use them together

The monthly pattern. The four-hour turn.

Start with a monthly report to understand large-holder posture and the groups behind it. Use Month in Motion to investigate a particular four-hour change. Return to monthly history to compare that activity with the groups’ longer pattern.

Public intelligence alerts

A public view.
A fraction of the picture.

Each public alert offers a small view of observed activity. Operational Reports connect movements with operating patterns, counterparty relationships, and history over time.

Loading monitoring intelligence…

Explore intelligence alerts
TrackBTC + CWOS — Shadow-Mode Pilot

Their movements.
Your perspective. Your call.

Evaluate one Bitcoin workflow through historical replay and live shadow mode in your environment.

Explore a shadow pilot
Six weeks from successful activation of shadow mode.
pilot@trackbtc.bot